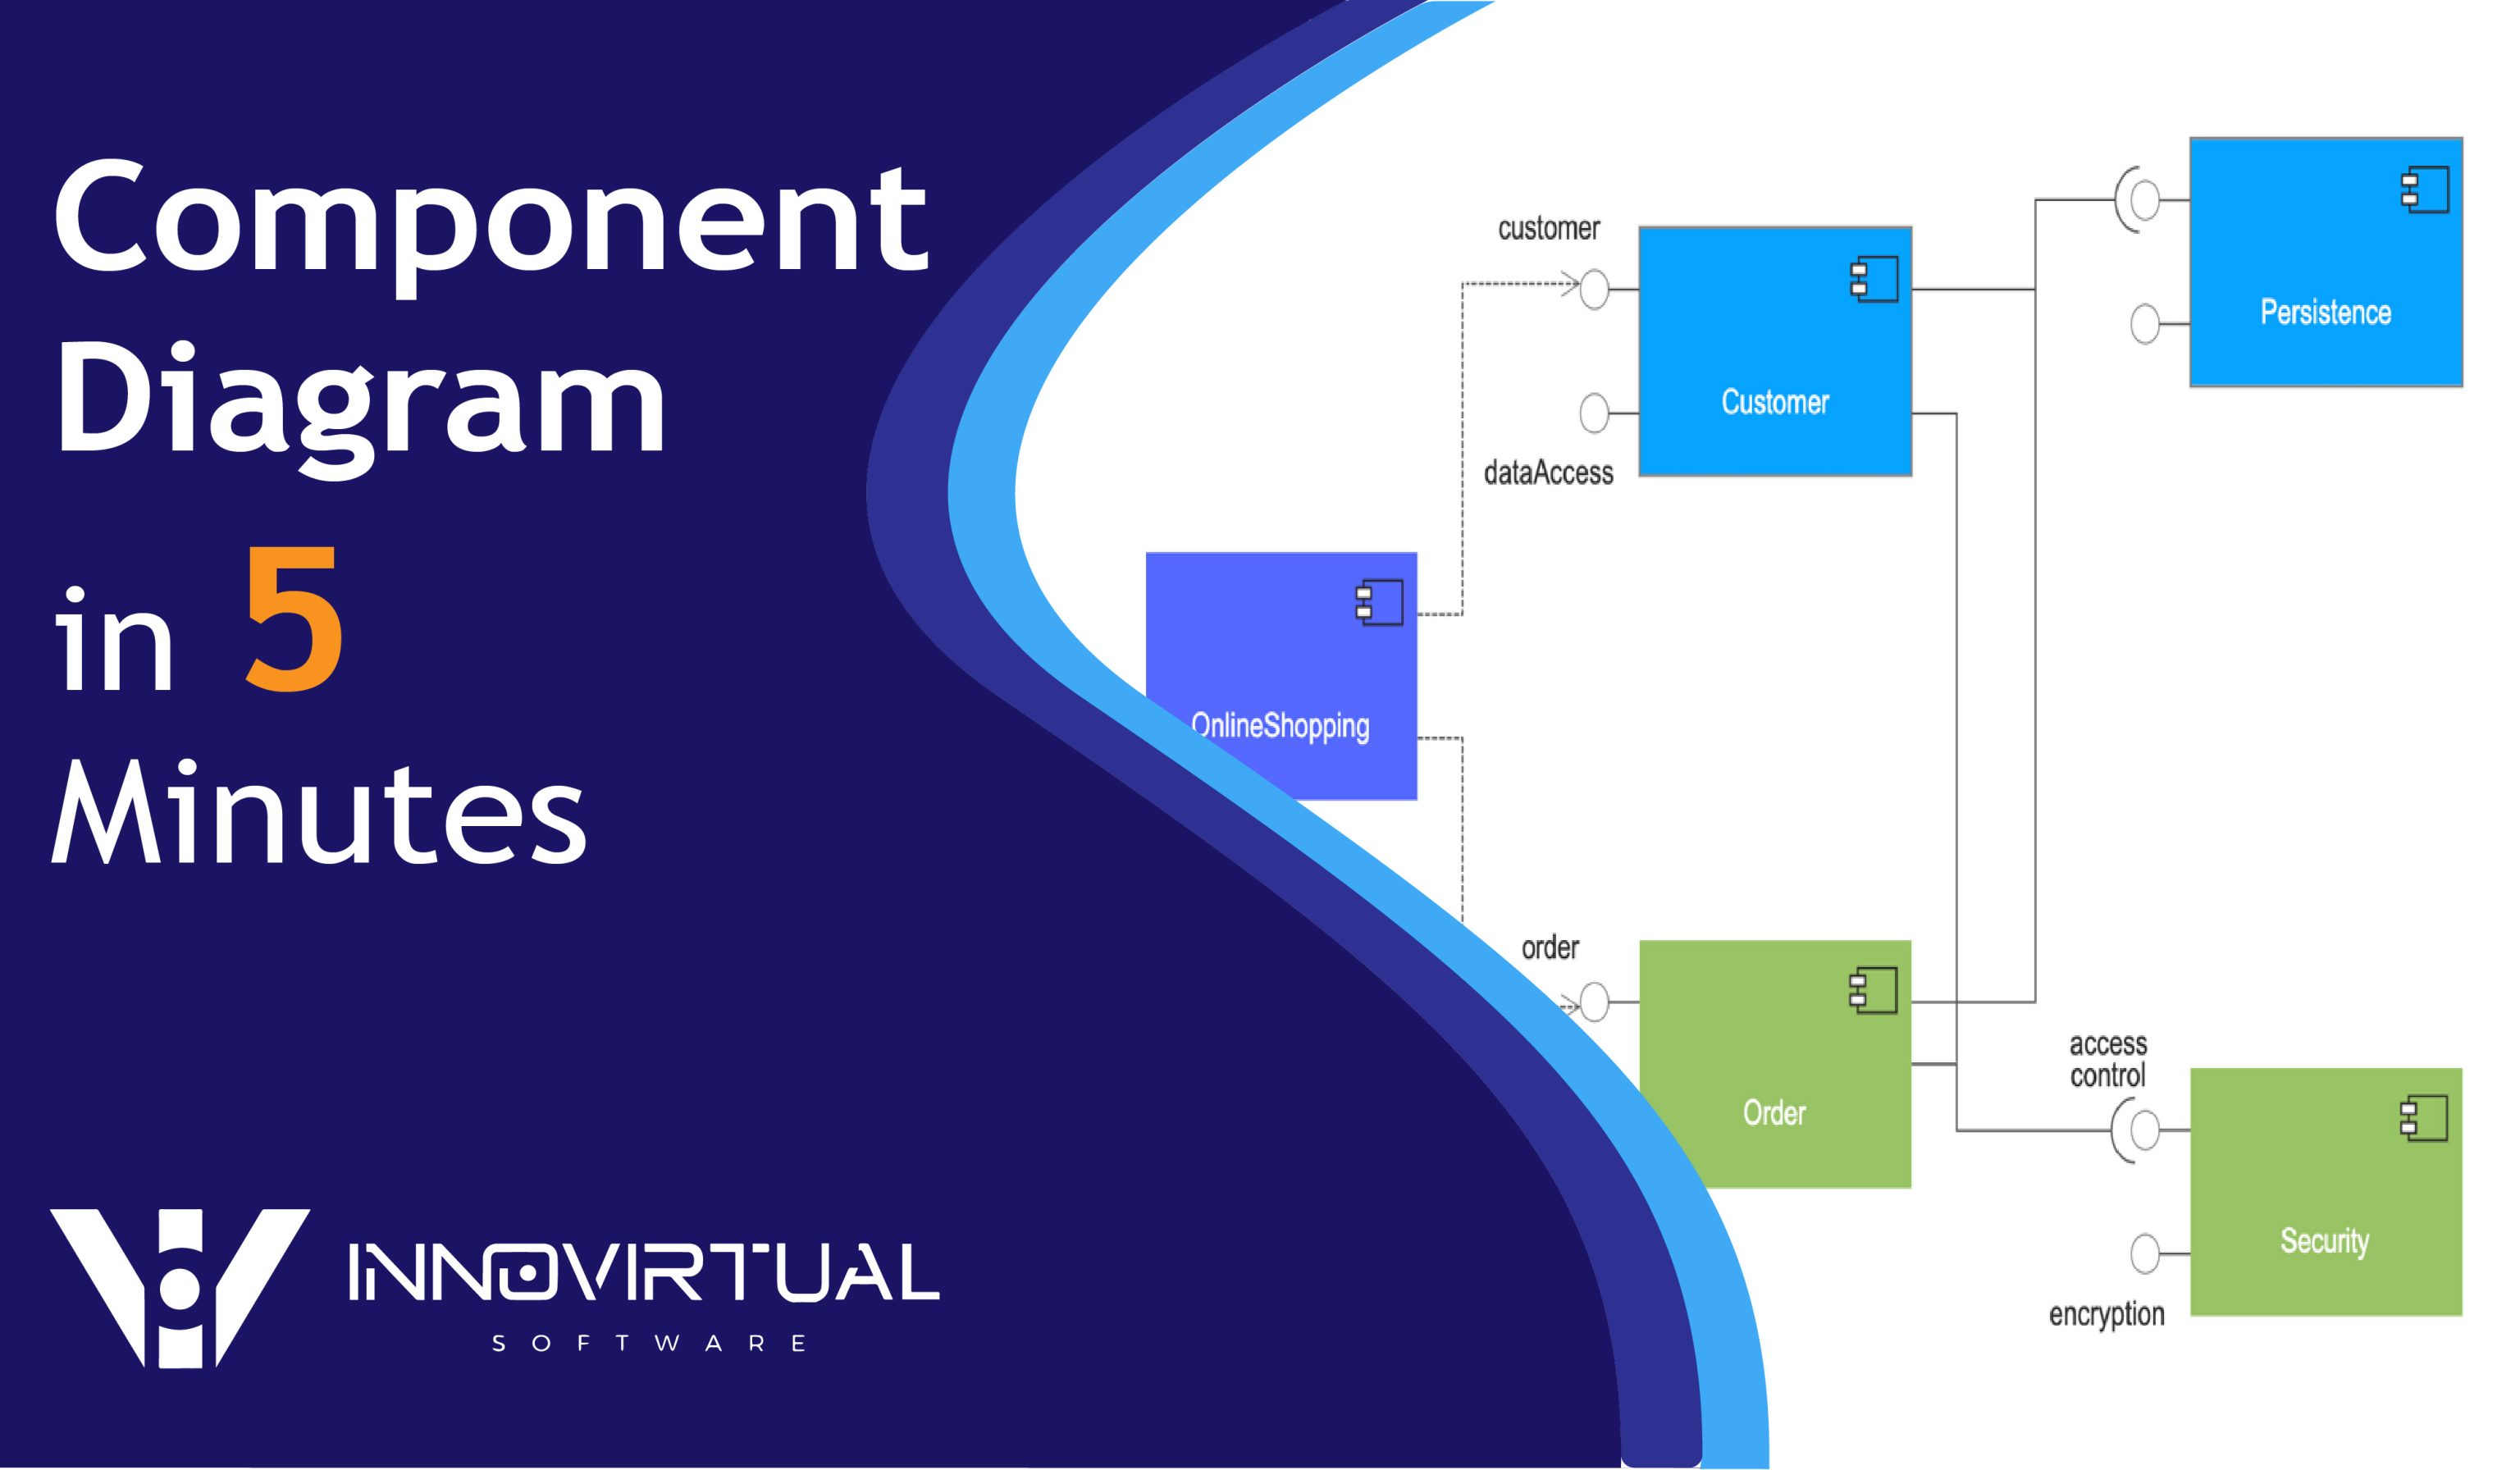
If you’re working with UML diagrams, you’ve likely come across Component diagrams. It’s a powerful UML toolkit that allows developers, designers, and stakeholders to visualize the system from a high-level perspective. The component diagram offers a clear picture of how the system components are behaving with each other by breaking the system into independent modules.
Whether you’re designing a microservice-based architecture or planning to develop and deploy a large-scale application, component diagrams bring clarity and insight, making it easy to understand and maintain.
In this article, we’ll dive deeper into the component diagram, observing its benefits and explaining the shapes and symbols used in the component diagram. We’ll also discuss the type of relationships in the component diagram.
What is a Component Diagram?
A Component Diagram is a type of UML diagram used to model the visual aspects of component-based software architecture, providing a high-level view of the system architecture by depicting the system components, their relationships, and interactions. It specifies the dependencies between system components and services and helps you plan the implementation.
You can think of a Component Diagram as a class diagram that focuses on the system components often used to model the implementation view of a system architecture. If you’re dealing with large systems, using a component diagram is a reliable approach to maintaining, upgrading, or replacing parts of the system without affecting the other parts of the system, ensuring flexibility and scalability over time.
Benefits of Component Diagrams
When it comes to designing, understanding, and maintaining complex systems, there are several reasons to prioritize the component diagram.
Modular Representation
The component diagram represents the system in a modular architecture. This approach breaks down the system into manageable and reusable components, making it easier to create, maintain, and upgrade individual system parts without affecting the entire system.
Visualizing High-Level Structure
The component diagram provides a high-level view of the system architecture, demonstrating how the system components are interconnected and interact with each other. This visual representation helps in communicating the system architecture to team members, clients, and stakeholders.
Defining Dependencies and Interfaces
Component diagrams clearly visualize the dependencies between components allowing you to identify which part of the system relies on one other. In this way, you can assume the impact of changes and minimize the risk of unintended consequences. Additionally, a component diagram clearly indicates what services a component offers and what service it depends on.
Improving Maintainability and Reusability
The component diagram makes the system easier to understand, maintain, and fix or debug by clearly visualizing the boundaries and responsibilities of each component. It organizes a system into a component-based architecture where the components are well-defined and reusable. This leads to saving the overall development time and reduces the dependency.
Managing Complexity in Large Systems
If you’re working on a large complex system such as a banking application, it’s crucial to use component diagrams for managing complexity. The component diagram serves as a clear reference that guides implementation, ensuring all system components align with the intended architecture.
4 Key Aspects of Component Diagrams
The component diagram consists of 4 major aspects,
Components
Components are the building blocks of the system, representing independent units or modules in the system such as classes, services, or other executables. Components also represent logical elements like business logic models or physical elements like servers, databases, and microservices.
Interfaces
Interfaces specify a collection of functions that a component offers or receives, creating a communication bridge between the system components and environments. Interfaces define how the components communicate with each other and ensure the components can be developed and maintained independently.
Relationships
Relationships illustrate the connection between components and interfaces, visualizing how components interact and depend on each other. These relationships can be of different types such as realization, dependency, and assembly connectors.
Ports
Represents specific interaction points between components, demonstrating how a component communicates with the environment and other system components. Ports offer you a clear view of how the system components integrate with one another, ensuring efficient and well-structured communication across the system.
Component Diagram Shapes and Symbols
Following are the common symbols and shapes used in component diagrams,
Component Symbol
Visualize the system components that provide and consume behavior through the interface.
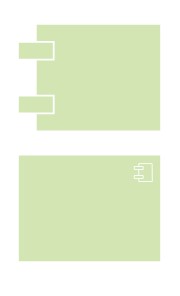
Node symbol
Represents software and hardware objects of the system that are higher than components.

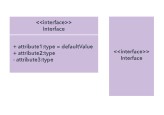
Interface symbol
Indicates the system component that receives or sends data, and behavior.
Port symbol
Defines the interaction between the system component and environment, specifying a separate interaction point.
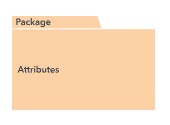
Package symbol
Defines a package. Packages are the collection of elements of the system.
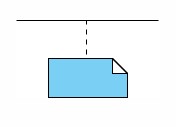
Note symbol
The note symbol allows you to attach a note to the design to make the diagram understandably easier. It’s helpful to describe complex parts of the system.

Dependency symbol
Indicates how one part of the system depends on another, explaining their relationship.

Note that this symbol may defer on various diagramming tools.
Relationships in Component Diagram
Component diagram leverages different types of relationships, representing how system components are connected and interact.
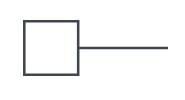
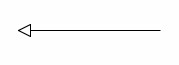
Association
An association specifies a semantic relationship between components. It shows that two components are linked and working together. A solid straight line is the notation of an association relationship.
![]()
Composition
Composite relationships are a strong type of aggregation that requires a system component to include at least one composite at a time. If you delete a composite relationship, all the components connected through this relationship will also be deleted.
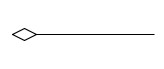
Aggregation
Aggregation is a type of association that shows two components are connected through an aggregation relationship, representing one component as part of another. Aggregation is not as strong as composition.
Constraint
Expresses the restriction or condition in a machine-readable language or natural language, defining specific rules and conditions that shape the behavior and relationships of the system component.
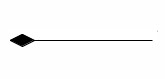
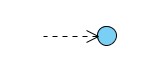
Dependency
It’s a type of relationship in which the implementation of a single or set of system components depends on the other single or a set of components. This illustrates the complete semantics of the depending components are either semantically or structurally dependent on the specification of the supplier component. If you make any changes on the supplier component, it can impact the depending components.
Links
Links indicate the generalization that is a taxonomic relationship between a more general classifier and a more specific classifier. It determines the generalization relationship within the overall software system.
Final Thoughts
That’s all for this topic.
Component diagram is an essential tool for developing robust and scalable software systems. It empowers your team to understand dependencies, design effectively, and communicate effectively by providing a crystal clear modular view of the system architecture.
Software modeling tools like Inno.navi enhance the diagramming capability of your team by not only supporting you to model the system architecture but also visualize your existing code base with its powerful reverse engineering feature.
If you have any questions or need any further assistance, feel free to contact us. We’ll be happy to assist you.
Component-Diagramme sind ein effektives Werkzeug, um die Struktur und Interaktionen von Systemkomponenten zu visualisieren, was die Planung und Wartung komplexer Systeme erheblich erleichtert! Telkom University Jakarta